部署运维
插件
dsh-webui-perf
awa-123-cw
DeepSeek Harness WebUI 性能优化开关插件:长代码流式渲染/历史加载/高亮缓存优化,设置面板一键开关(with official-package patches)
deepseek-harnessdshdsh-pluginperformance
loongsuite/dsh-plugin
OpenTelemetry tracing for DeepSeek Harness (dsh): turns each agent turn into a GenAI span tree — steps, LLM calls with TTFT, tool executions, token usage — exported over standard OTLP to Jaeger, Grafana Tempo, SigNoz, Langfuse, or any compatible backend.
PROJECT TOPICS
PROJECT README
English | 简体中文
@loongsuite/dsh-plugin is a standalone, open-source observability plugin for
DeepSeek Harness (dsh). It observes DSH's native
session, agent loop, LLM stream, and tool lifecycle, converts them into OpenTelemetry GenAI traces
and metrics, and exports standard OTLP/HTTP protobuf to any compatible backend.
LoongSuite is an open-source observability collection ecosystem built on OpenTelemetry. This repository is its native DSH integration. The plugin does not depend on or require LoongSuite Pilot, a sidecar, a local JSONL tap, or any particular vendor's backend.
Status: beta release. Install the npm beta with
@loongsuite/dsh-plugin@beta. The plugin is listed in the community registry, so it can also be installed from the DSH plugin market.
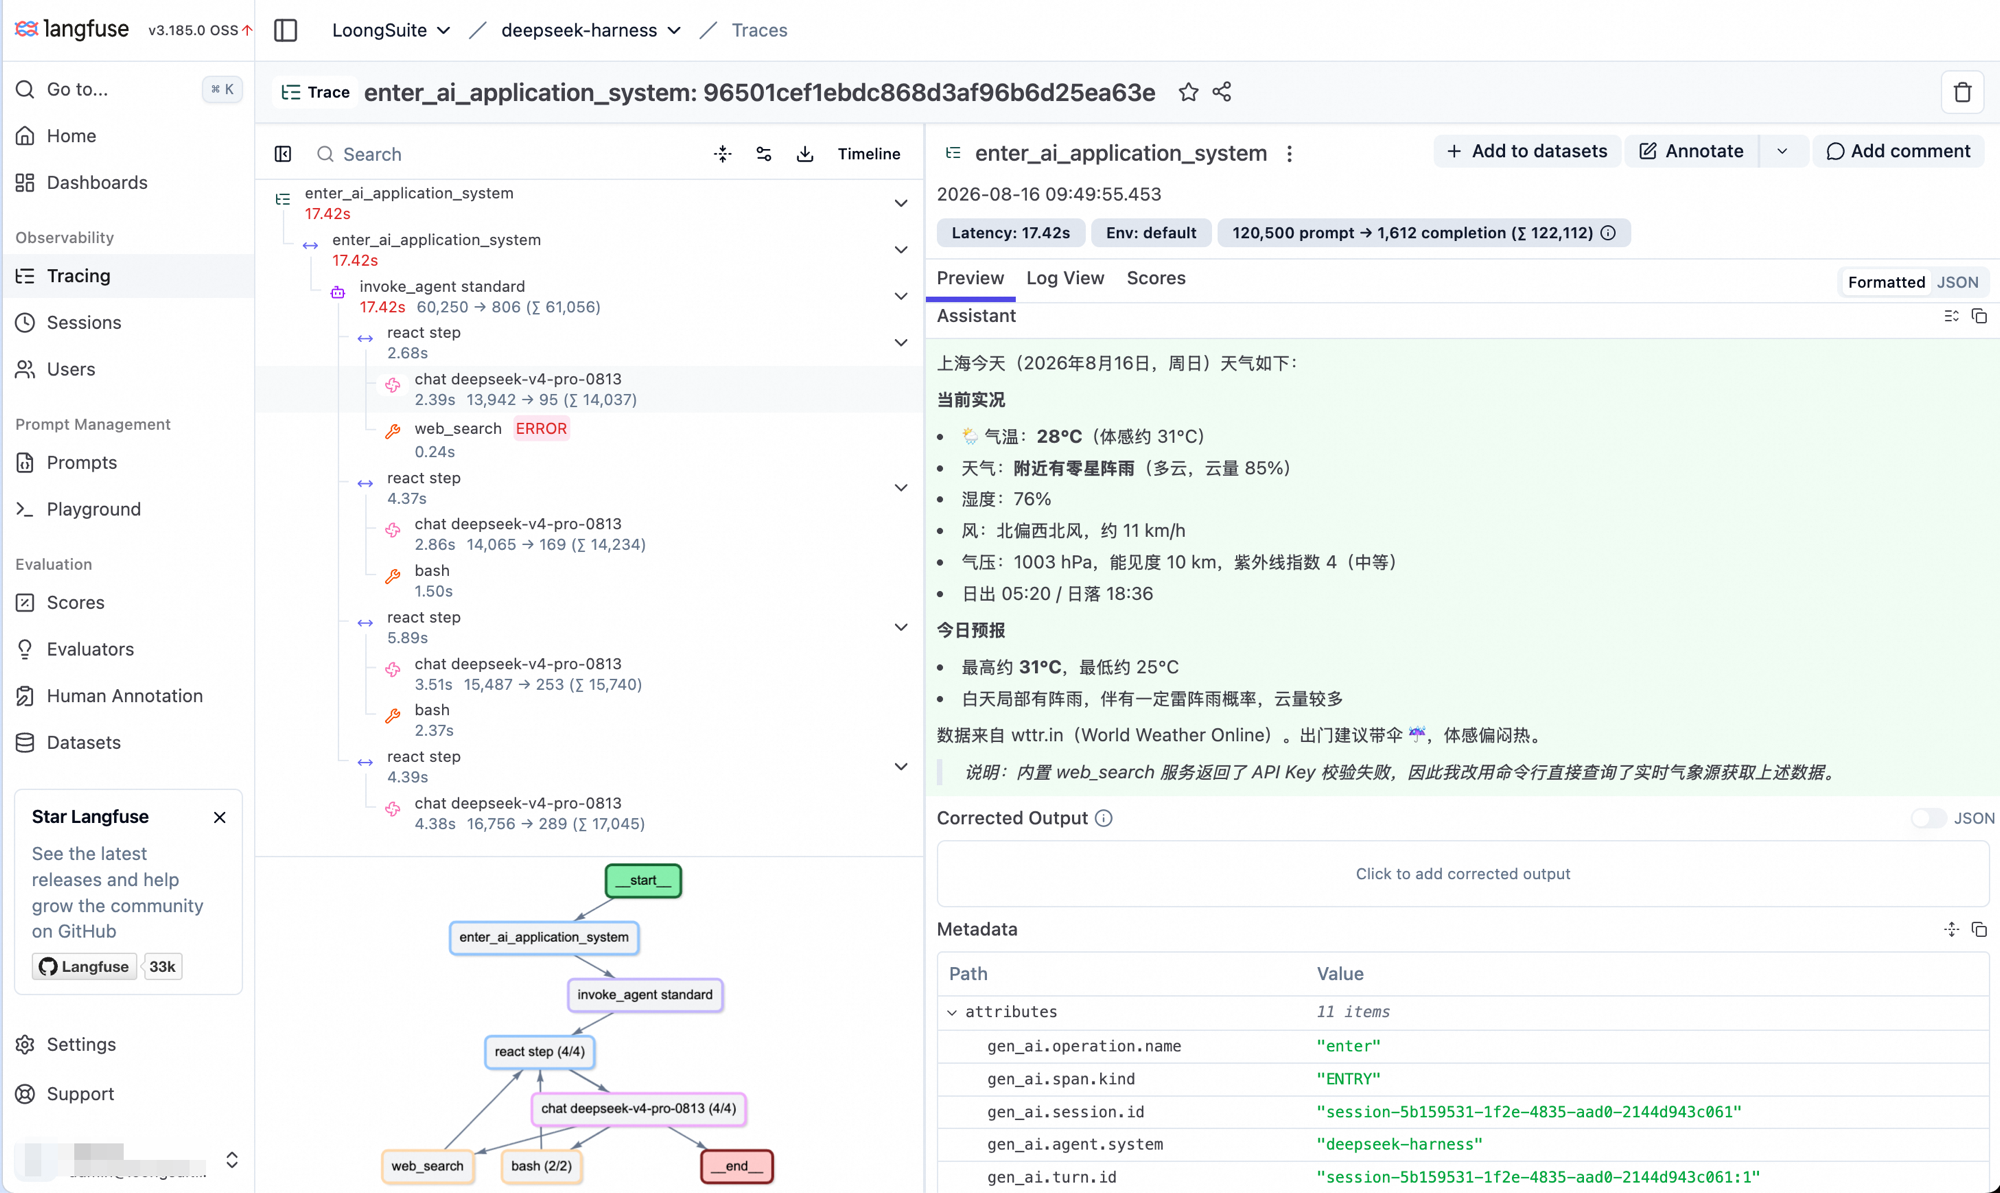
One DSH turn exported over OTLP into self-hosted Langfuse: four react steps, per-call latency
and token counts, a failed web_search followed by bash fallbacks, and the
ENTRY span's GenAI attributes. Content capture was enabled for this capture; it is off by
default.
DSH session/event + llm/stream
                │
                ▼
      lifecycle coordinator
                │
                ▼
   LoongSuite GenAI OTel utility
                │
                ▼
 private TracerProvider + MeterProvider
                │  OTLP/HTTP protobuf
                ▼
  any OpenTelemetry-compatible backend
One DSH turn produces a single trace with this shape:
ENTRY
└── AGENT
    └── STEP
        ├── LLM
        └── TOOL
Each real LLM attempt gets its own LLM span, so retries remain visible under the same step. Tool
calls are correlated with their results by DSH call ID. Errors, aborts, incomplete streams, and
plugin shutdown close live spans with an error status instead of leaving them open. Subagent
sessions create their own trace and carry DSH parent-session and delegation attributes.
The plugin also exports the standard gen_ai.client.operation.duration and
gen_ai.client.token.usage metrics. It does not export OpenTelemetry logs; it can coexist with a
separate DSH log exporter.
GenAI invocation construction and semantic attributes are powered by the
@loongsuite/otel-util-genai SDK.
| Component | Supported range | Fully verified version(s) |
|---|---|---|
| DeepSeek Harness | >=0.1.0-rc.6 <0.2.0 |
0.1.0-rc.6 headless and Web profiles |
| Node.js | >=22.19.0 |
22.19, 24.19, and 25.9 on macOS |
DSH release candidates older than 0.1.0-rc.6 are not supported. The beta is tested against the
latest published DSH release rather than treating successful bundle composition alone as full
runtime compatibility.
If you have no OTLP backend yet, examples/quickstart starts a
local Collector and Jaeger and gets you a trace in three commands.
During the beta, add the beta tag to every DSH profile you want to observe:
dsh plugin --profile web add @loongsuite/dsh-plugin@beta
dsh plugin --profile headless add @loongsuite/dsh-plugin@beta
For local development, replace the package name with the checkout path:
dsh plugin --profile web add /absolute/path/to/dsh-pluginSet a service name and an OTLP/HTTP collector endpoint, then start that profile normally:
export OTEL_SERVICE_NAME=dsh-agent
export OTEL_EXPORTER_OTLP_ENDPOINT=http://localhost:4318
export OTEL_EXPORTER_OTLP_HEADERS='authorization=Bearer%20your-token'

dsh --profile web
# or: dsh --profile headless "summarize this workspace"
The shared endpoint is expanded to /v1/traces and /v1/metrics. The exporter uses the standard
OpenTelemetry default when no endpoint is configured.
Environment variables are enough for most deployments. You can also edit the plugin row in
$DSH_HOME/profiles/<profile>/cordis.patch.yml (by default under ~/.dsh):
- id: loongsuite-observability
  config:
    endpoint: http://localhost:4318
    serviceName: dsh-agent
    headers:
      authorization: Bearer your-token
    resourceAttributes:
      deployment.environment.name: development
    captureContent: false
    exportMetrics: true
Explicit plugin settings take precedence over environment variables.
To enable content capture without editing the profile, set the GenAI content mode before starting DSH:
export OTEL_INSTRUMENTATION_GENAI_CAPTURE_MESSAGE_CONTENT=SPAN_ONLY
dsh --profile web| Setting | Default | Meaning |
|---|---|---|
enabled |
true |
Disable collection without uninstalling the bundle. |
endpoint |
unset | Shared OTLP/HTTP base URL; the plugin appends each signal path. |
traceEndpoint / metricEndpoint |
unset | Complete signal-specific URL; takes precedence over endpoint. |
headers |
{} |
Headers added to both exporters. |
serviceName |
OTEL_SERVICE_NAME or deepseek-harness |
OpenTelemetry service.name. |
resourceAttributes |
{} |
Additional string-valued resource attributes. |
captureContent |
environment setting or false |
Export prompts, responses, tool definitions, arguments, and results. |
contentMaxChars |
128000 |
Maximum serialized characters per captured content attribute. |
exportMetrics |
environment setting or true |
Export LLM duration and token metrics. |
maxExportBatchSize |
512 |
Maximum spans per export batch. |
maxQueueSize |
2048 |
Maximum queued spans. Must not be smaller than the batch size. |
traceExportIntervalMs |
5000 |
Trace batch delay. |
metricExportIntervalMs |
60000 |
Metric export interval. |
exportTimeoutMs |
30000 |
OTLP export timeout. |
debug |
false |
Emit additional plugin lifecycle diagnostics through the DSH logger. |
Supported standard OpenTelemetry variables are:
OTEL_EXPORTER_OTLP_ENDPOINTOTEL_EXPORTER_OTLP_TRACES_ENDPOINT and OTEL_EXPORTER_OTLP_METRICS_ENDPOINTOTEL_EXPORTER_OTLP_HEADERSOTEL_EXPORTER_OTLP_TRACES_HEADERS and OTEL_EXPORTER_OTLP_METRICS_HEADERSOTEL_SERVICE_NAMEOTEL_RESOURCE_ATTRIBUTESOTEL_INSTRUMENTATION_GENAI_CAPTURE_MESSAGE_CONTENT (SPAN_ONLY or SPAN_AND_EVENT enables span content when captureContent is omitted)OTEL_METRICS_EXPORTER (none disables metrics when exportMetrics is omitted)Header and resource values use the standard comma-separated, percent-encoded key=value syntax.
Content capture is off by default. With that default, prompts, responses, tool schemas, arguments,
and results are not attached to spans; structural metadata and token counts are still exported.
Enabling captureContent or setting the content-capture environment variable to SPAN_ONLY or
SPAN_AND_EVENT can send source code, credentials, personal data, or other sensitive content to
the configured backend. Review backend retention and access controls before enabling it. Set
captureContent: false explicitly when a profile must remain content-free regardless of the
process environment.
The plugin owns private OpenTelemetry providers and never replaces DSH's or another library's
global provider. It also disposes listeners and flushes providers with the DSH plugin lifecycle.
When attached to an already-running/HMR-reloaded profile, it adopts existing session identities but
starts collection at the next native turn/start; historical events are not replayed or duplicated.
Node.js 22.19 or newer and pnpm are required.
pnpm install
pnpm run check
pnpm test
pnpm run build
pnpm pack
See CONTRIBUTING.md for the implementation invariants and release checklist.
CLASSIFICATION EVIDENCE
系统优先读取 GitHub Topics,再与站内分类词典和词根规则比对。
awa-123-cw
DeepSeek Harness WebUI 性能优化开关插件:长代码流式渲染/历史加载/高亮缓存优化,设置面板一键开关(with official-package patches)
caiyfa
deepseek-harness (dsh) 全局 Token 用量看板插件 —— 一行命令安装,后台常驻增量统计全部会话:按模型/按时间/按会话的用量趋势(分钟·小时·天 × 柱状/堆叠/累计)、红绿异常时点标记与按会话异常分组,子代理消…
gordonlu
Request Context Profiler for DeepSeek Harness — see what changed between model requests, and how cache reuse changed wit…